This article analyzes the historical performance of the Nikkei 225 index.
Introduction
The Nikkei 225 is Japan's leading stock market index, with calculations beginning in 1950 (Ref. Nikkei Stock Average Calculation Guidelines).
This article analyzes the historical returns of the Nikkei 225.
Note: This article was translated from my original post.
Data Source
The data presented in this article is based on information retrieved from the Yahoo! Finance API using yfinance, which the author has analyzed and visualized.
※ Disclaimer: This site publishes content that the author has researched for educational purposes. While we strive for accuracy, we do not guarantee the reliability of this information. This content does not constitute investment advice or recommend any specific products. Please invest at your own risk. For details, see here.
Historical Returns of the Nikkei 225
Annual Returns
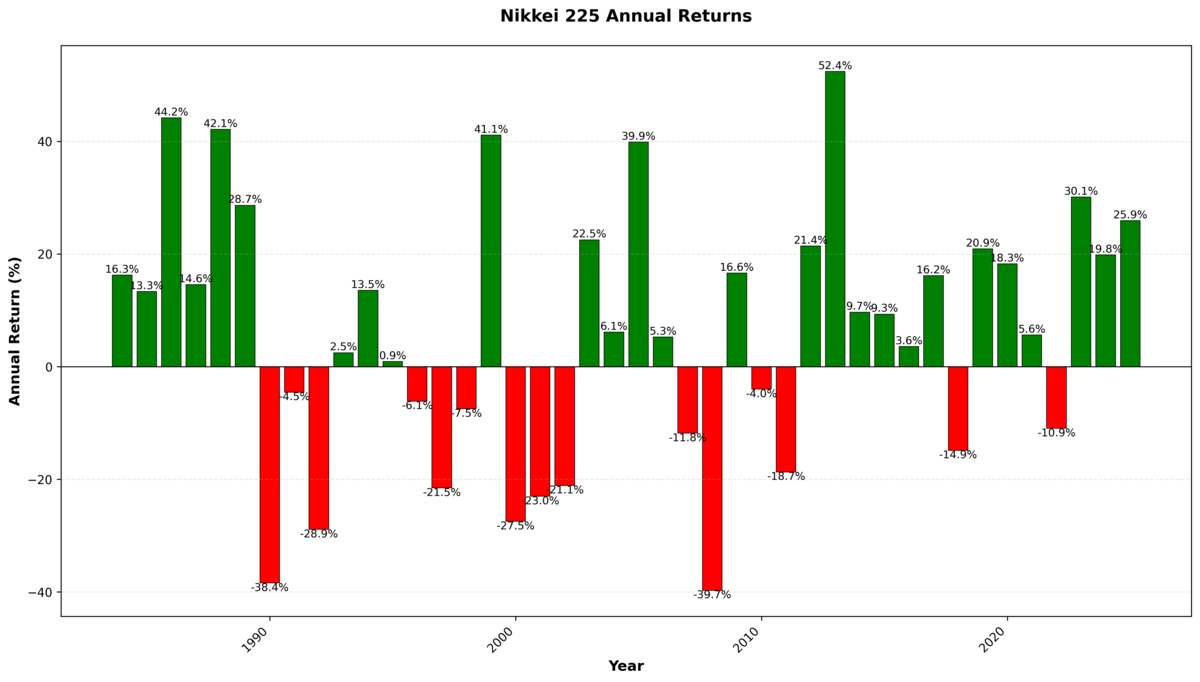
This chart shows the annual returns of the Nikkei 225 (excluding dividend reinvestment). Data is visualized from 1984 onward, when it became available.
In the 20 years following 1990, years with negative annual returns are notably frequent.
Annualized Returns
| Period | Annualized Return |
|---|---|
| Past 3 years | 22.03% |
| Past 5 years | 13.08% |
| Past 10 years | 10.05% |
| Past 20 years | 6.02% |
| Past 30 years | 3.22% |
| All periods (since 1984) | 3.9% |
These are the annualized returns calculated backward from the time of writing (excluding dividend reinvestment). For the full period, data is aggregated from 1984 onward, when data became available.
Even over the past 30 years, which includes periods of poor Nikkei 225 performance, the annualized return remains positive. Recent figures show strong returns, driven in part by the weak yen.
Index Performance
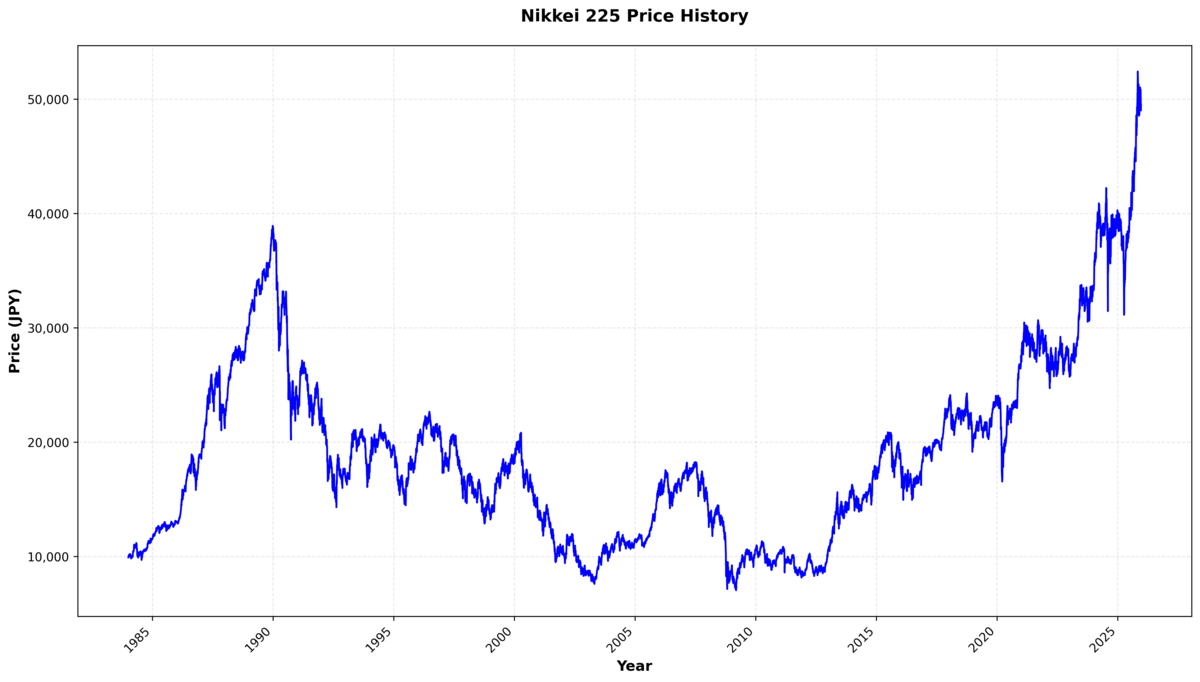
Here's the price movement of the Nikkei 225.
The chart clearly shows the 30-year slump following the 1990 bubble collapse, followed by the index reaching a record high in 2024 for the first time in 34 years.
Conclusion
This article has compiled research on the historical returns of the Nikkei 225.
Many major global stock indices have shown upward trends over recent decades. The Nikkei 225, however, displays a distinctive U-shaped pattern, revealing unique characteristics of the Japanese market.
I hope this information proves useful.
[Related Articles]